
TL;DR 👋#
I’m a Data-Analyst from New Zealand living in Edinburgh, Scotland.
I’ve been doing Data Stuff (including but not limited to Software Engineering, UX/UI Design and Development, Video and Graphics Editing, Project Implementation) for ~ 3 years at this point, with a key area that I enjoy being the dissemination of complex and or technical information to a large audience, emphasising design and purpose that fits the need of an end user.
i.e. I like making shit that people use and enjoy.
Skills 🎯#
I always think it’s a little silly to have to create a skill matrix for yourself and boil an entire person down to just some skills or characteristics. However, just taking a look at this chart gives you a good idea of what kind of skills I have out of the box.
I’ve expressed my level of “skill” in a given area, by providing a value between 1-10 (1 being a complete novice, 10 being a master). The catch with a skills matrix is that different people will interpret your skills in different ways, combined with the fact that mastery is easy to point out, but hard to define.
I do think though, if you do want to get a really good vibe on who I am, and what I can do for you, it’s much better that you evaluate my skills based on the outputs of my work, as opposed to a skill matrix that I could in theory, be bullshitting on.
NOTE: I’ve noticed this chart has some text cut-off on mobile, best to view the site on desktop anyway.
Skill Matrix Spider Chart 🕷️#
NOTE: Don’t view this in light mode, I haven’t got this configured to be able to dynamically check which theme people are using and then switch around colour elements. Just use dark mode!
Long Version 📜#
Heyo! - My name is Russell David Chubb.
At the time of writing this, I’m 25 years old. I was born in Brisbane Australia, and moved over to New Zealand when I was around ~ 1 year old. I grew up in Palmerston North, and studied in Wellington, then, moved to Masterton to be closer to my girlfriend and her family!
Somewhere in late 2026, I’ll be settling down in Edinburgh, Scotland, wherein I’ll be exploring a brand new country!
Free Time Donut Chart 🍩#
When I’m not doing “Data Stuff”, I’m normally engaged in one of the following activities (shown in this donut-graph):
Computer Origins 🌱#
I still remember the exact moment I first used a computer, I would have been about 7 or 8, and the computer would have looked something like the below image:

Since that pivotal moment, I’ve been completely enthralled in them. It’s hard to say the amount of hours I’ve spent behind a computer screen, but I’d have to guess that it would be up there at maybe > 30,000 Hours over the course of my entire life (Jeez touch grass much)

I guess you could say that I first started “programming” circa 2016, when I was playing around with CS:GO Hacked Clients and Scripts, I remember following a YouTube video for how I can download Visual Studio, pasting some C++ code (which would have essentially been straight jibberish to me), and then injecting code into the CSGO run-time, just to bunny-hop around servers. (good fun would recommend it).
Cheating is against Steam Services ToC and can result in punishment (I got banned lol)

Even though I was coding (coding is a loose term to describe what I would have been doing back in 2016) in my free-time, I never picked up any computer sciences subjects in school, or even really understood how I could utilize computing as a skill that other people would be interested in. As such, in high-school I was actually studying to become an accountant, an idea, which, once I actually started studying accounting at University, went down the drain very quickly. Long story short, I pivoted across to Marketing and Management, and graduated from Victoria University, Wellington in 2023.

Now, I know this doesn’t really explain where those “data skills” I listed above came from. As it turns out, all a Marketing and Management Degree gives you is about $50,000 worth of student loan debt, a bunch of life-long friends, and the ability to sink brews at an alarming rate.
Working at the Ministry of Education 💼#
I managed to get a job prior to finishing my degree as a “Implementation Advisor” at the Ministry of Education (MoE) working on a project to remove the Decile System from the New Zealand Education System.
What is a Decile?
During this role, I engaged with a variety of Education Subject Matter Experts (SME’s) to understand how decile was baked into a variety of initiatives, and work out how we can use the new “Equity Index” system instead.

During this role, I was moved towards the ICT Business-Unit within MoE wherein I got to engage and work first-hand with ICT Professionals for the first time in my career, and I actually attribute this, (combined with inspiration from a Data-Analyst within my team at MoE - shout out to you Scott), for first opening my eyes to the world of data, and the outcomes that can be gleaned from it.
Anyway, once the project had wrapped up, I moved horizontally within MoE across to the Web-Services team, working as a “Web Advisor”. It was during this role that I got my first kind of exposure to Web Development, Including:
- Business Analysis (requirement gathering, project planning etc).
- Design (Designers and Front-End Developers working hand in hand, Wire-Frame Development, Figma etc),
- Web-Accessibility Standards,
- Backend-Development (Development, Cloud Hosting etc)
- And much more!
With this being said, my actual responsibilities in this role were limited to tending to the Web-Service Help Queue, making edits to the portfolio of .education.govt.nz using their CMS systems, as well as assisting with testing to websites following feature releases or bug fixes.
During this role was the first time that I actually began “working” directly with data. I was assigned responsibility for managing the Ministry of Educations Google Analytics Platform, ensuring that traffic volume data, usage patterns and user journey information was recorded, and continually flowing. It was also during this time that I created my first dashboard using Looker Studio (which I believe was a further breakdown of a user-journey map for a specific .education.govt.nz site which I can no longer remember the name of).
Ministry of Education Dashboards 📊#
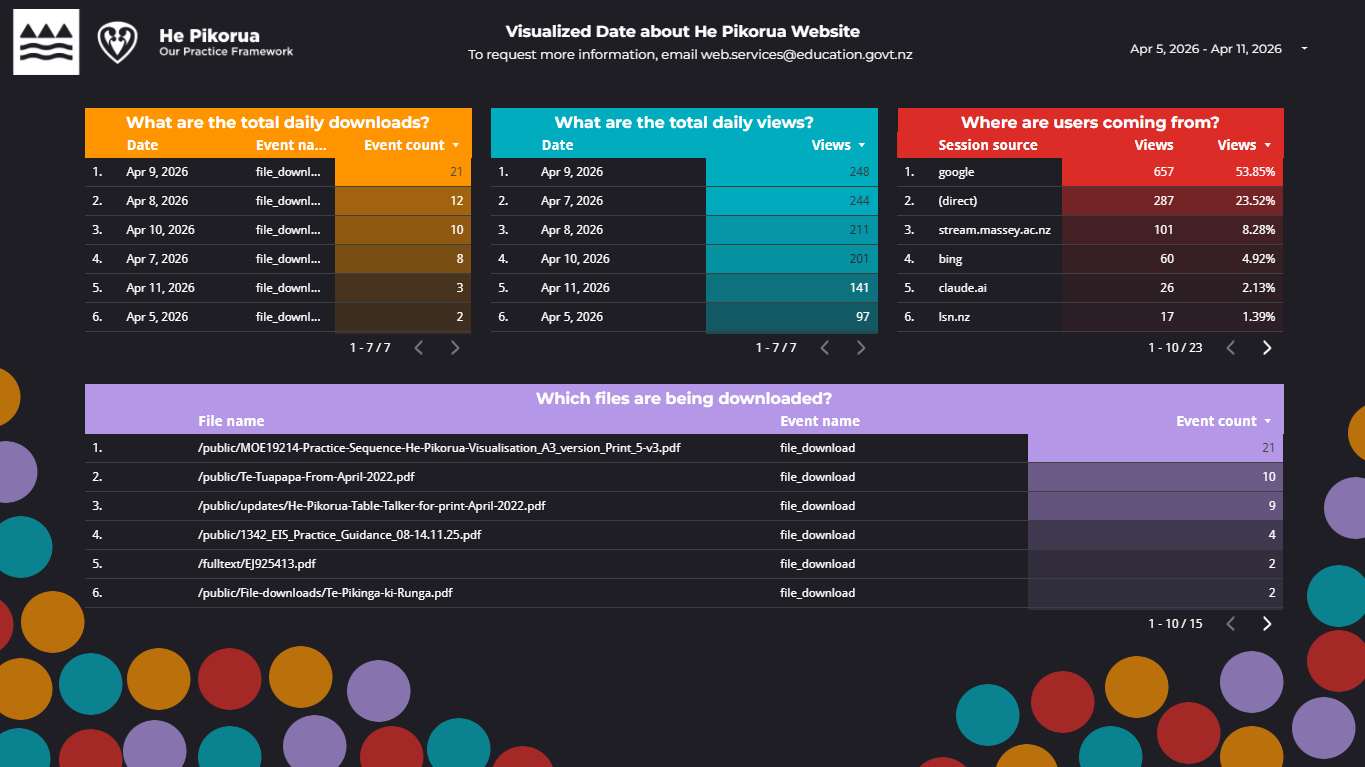
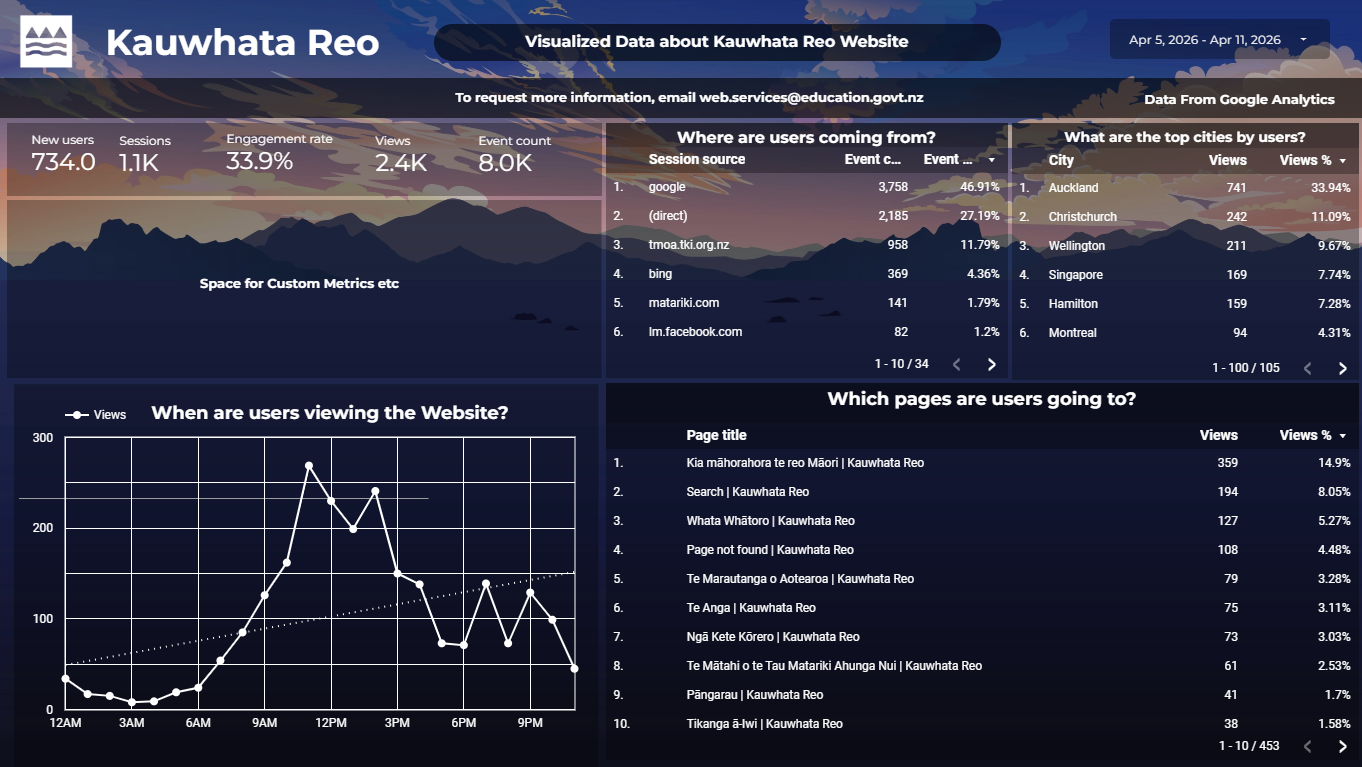
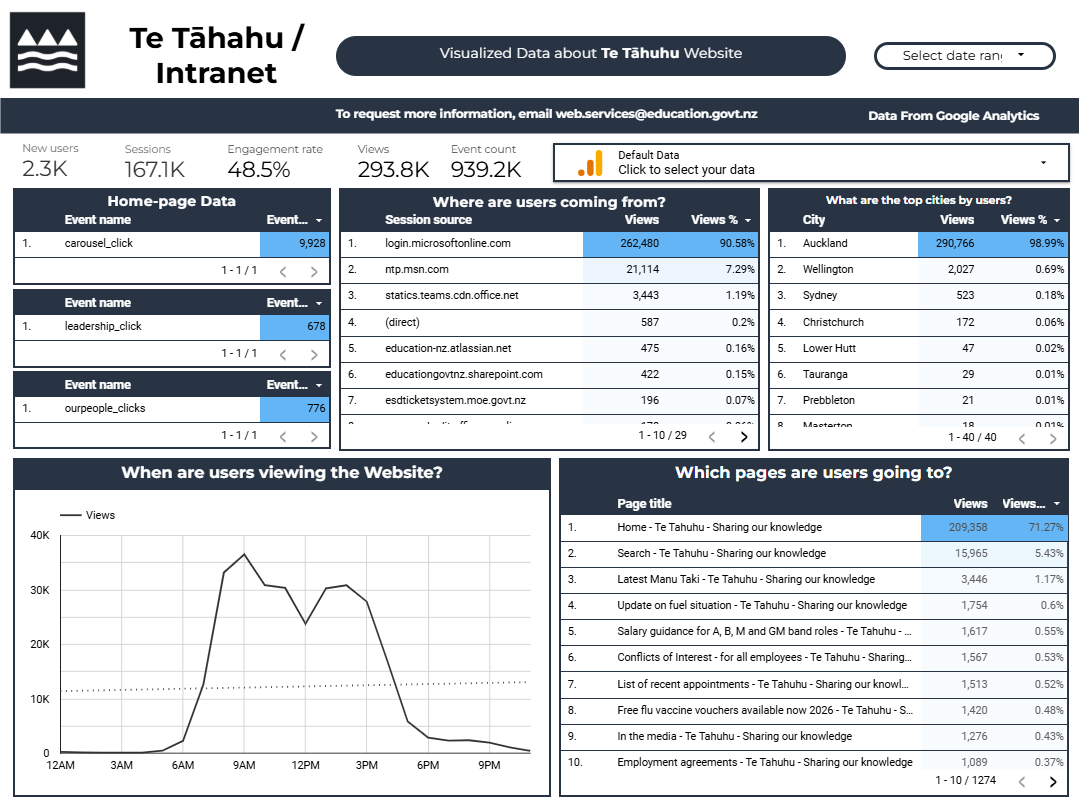
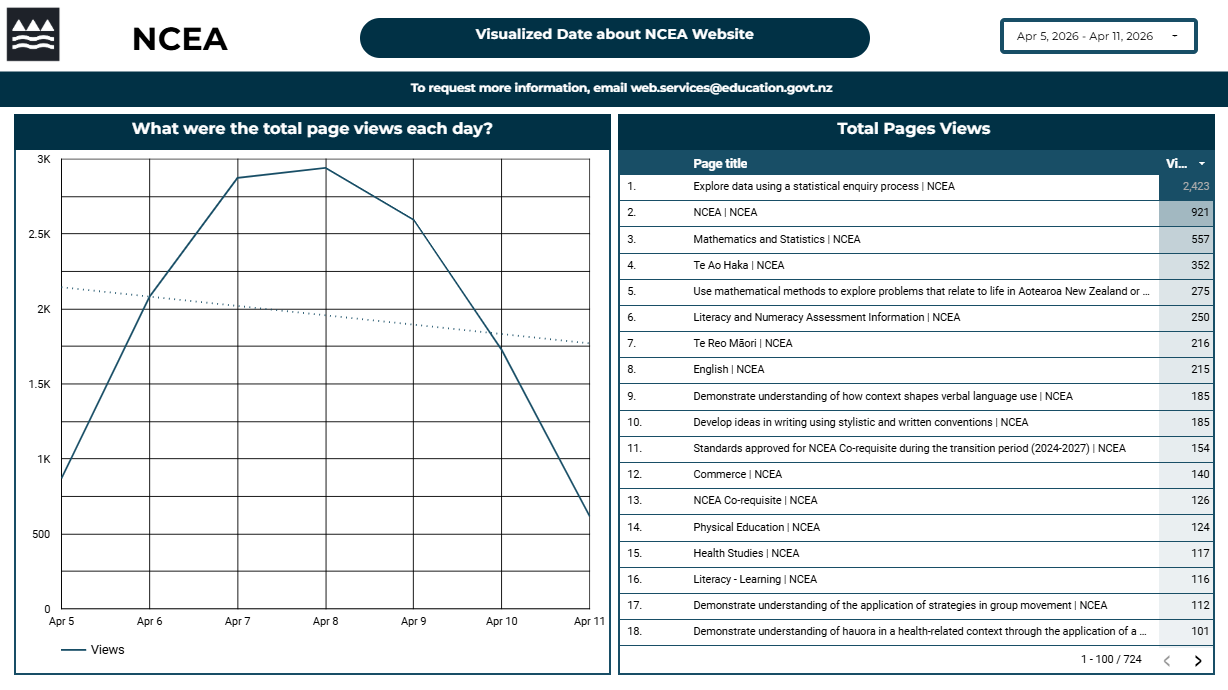
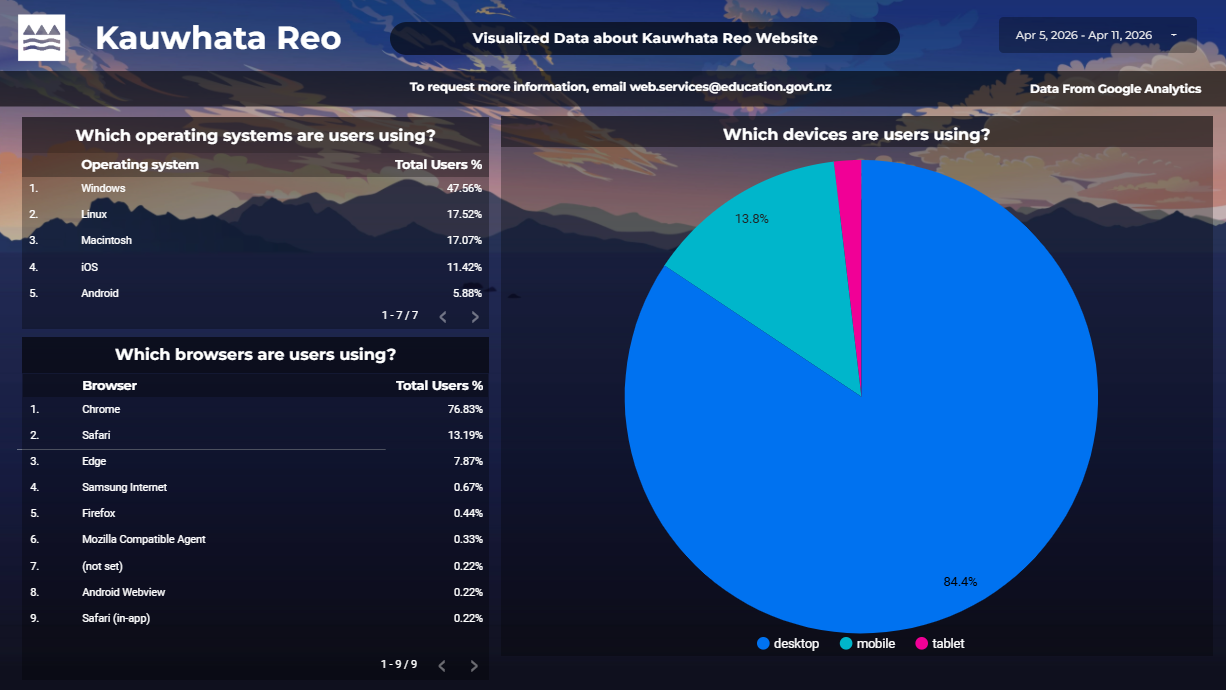
After developing my first dashboard, I got bit with the “data bug”, as there was just something so satisfying about the creation of something that could be both:
- Technical.
- Good to look at.
Self Driven Data Studies 🔬#
At a certain point, I really got interested in the idea of doing Data-Analysis as my full time job. As, I began devoting a significant portion of my free time to the pursuit of this goal. However, before you can spend time actually studying, you need to know what your syllabus looks like. As such, I spent a large portion of time working out what skills and technologies data-analysts actually need to perform, which led me to discover the following topics:
- SQL
- Python
- Databases
- Data Modelling
- Business Intelligence / Data Visualisation (PowerBI, Tableau etc)
- Databricks
- Statistics
- UX / UI
I’m always so proud when I look back on where I came from, to where I am, and what I can do today. I don’t remember exactly how I got started in all of this, but I’m pretty sure I would have googled something along the lines of “how to become a data analyst”.
One of the best resources I found on my search would have been the Roadmap.sh website. I specifically landed on the BI Analyst Roadmap (shown below).
BI Analyst Roadmap

From here, I basically had the topics that I needed to “study-up on” in order to become competent in this new field. This was very helpful early on, as (at least personally) I find that I can learn best when I have a top-down understanding of what is actually involved in a certain topic, or field.
Regardless, after this, I spent a large amount of time researching different topics, watching videos, writing notes etc.
Eventually however, I got to a really solid starting point as a data-analyst, I had some technical understanding and practice with SQL, Python, BI, which are effectively the pillars of a Data Analyst role, wherein I was ready to begin applying!
I would actually recommend that more people go-down a path of semi-self driven study, as I attribute this work with expanding my:
- Creativity
- Presentation
- Problem Solving
- Communications
- And Much more!
YouTube Channel 📹#
Now, I’d say that the chips are stacked against you when you’re trying to get your first Data-Analysis role. Ideally, I’d recomend you try make this move when the global economy is in a solid place (rather than one where you rotate in and out of crises and recessions).
I say this because of my first experience trying to land a data-role.
To put it bluntly, I struggled. I found that I wasn’t getting much traction with recruiters, or hiring managers, and thus wasn’t getting any job-offers.
This was during a particularly difficult period in my life, as I had just been made redundant from my previous job, and as such, needed to “clutch up”, or else face some fairly negative prospects.
However, this is where that old phrase “pressure makes diamonds” really shines through, as I began thinking about how I could “stand out” from other applicants (and thus increase my chances of landing a role.)
This is where the original idea for starting my YouTube channel came from, as prior to that, it was just an idea that floated around in my mind.
As such, I immediately began work planning videos, developing a channel logo, banner, intro, outro etc. When I had finished all this, and had a plan for the videos I wanted to create, I suddenly found myself stuck. I was in a phase that some have coined “analysis paralysis”, which is a state of mind where you do so much preparation that you never end up actually creating, or doing anything.
I was only able to break out of this state of mind when I listened to someone talk about how your first YouTube videos aren’t going to be good, regardless of how much planning you do, and that you’ll only ever get better by creating more videos.
Almost as soon as I heard this advice, I got straight into creating my first video; “Introduction to Python”… 24 videos later, and I’ve grown the channel to ~ 560 Subscribers (at the point of writing this).
Working at Meridian Energy 💼#
Anyway, 42 Job Applications, 2 Interviews, and two follow-up interviews later, I was offered a role as a Data Analyst at Meridian Energy.
Knowing what I know now about Meridian Energy, I only wish I could have been working for them sooner. The people that I’ve met at Meridian are so incredibly smart, kind and caring.
What does Meridian do?
The business unit that I inserted into is called “Generation” which is primarily concerned with ensuring Meridian’s 7 Hydro Stations and 6 Wind Farms are running in the most optimal fashion, through timely and proper maintenance, and management.
This was quite a shock to me, as prior to this role at Meridian, I never even thought about a power-station, other than in passing. As such, the domain context was quite a lot to take in, and I very quickly learned that I was a non-engineer in a sea of engineers.
Much like any situation I found myself in, I was eventually able to build an understanding of the Power-Generation Industry.
I found myself quickly coming to understand what the terms (like the following), actually meant:
- “MW vs MWH”
- “Wind Power Curve”
- “Nacelle”
- “Transformers”
- “Penstocks”
- “Wicket Gates”
- “Under Frequency Events”
- “Revenue Metering”
And so, so, so many more…
Well, that concludes my “about” page! - Thank you so much for reading!
Cheers!