
Unless you’ve been living under a rock you’ve probably either heard about, ingested from, or implemented some form of Medallion Architecture (as long as you’re anywhere adjacent to a Data-Role).

Now, the concept of having separations between different layers of data quality has been around almost since the beginning of data.
However, somewhere along the way, sensible ideas about organising data turned into “The Medallion Architecture™”, complete with:
- Diagrams
- Conference talks
- Consulting decks
(I’m looking at you Databricks Marketing / Sales Team)

What is Medallion Architecture? 💭#
Medallion Architecture is a way of organising data into progressively more useful layers. The three commonly used layers are:
- 🥉 Bronze — raw data
- 🥈 Silver — cleaned and structured data
- 🥇 Gold — business-ready data
The important thing is that each layer has a different job, and that despite the naming convention (I’ll touch on this later), there is value in each of the layers.
Bronze 🥉#
You can think of “Bronze” as the landing zone for raw data. The primary objective in this space isn’t to make the data beautiful, it’s to preserve what you have received.

Let’s now imagine a company called “Russell’s Energy Company” which ingests data from IoT devices every 5 minutes.
At “Russell’s Energy Company” this IoT data gets moved into a bronze table with some additional ingestion metadata. Readings arrive in batches, and sometimes a source resends a reading it got wrong.
| timestamp | site | generation_mw | _ingested_at | _source | _batch_id |
|---|---|---|---|---|---|
| 2026-10-01 10:00 | Site A | 42.7 | 2026-10-01 10:11:02 | IoT | 001 |
| 2026-10-01 10:00 | Site B | 51.2 | 2026-10-01 10:11:02 | IoT | 001 |
| 2026-10-01 10:00 | Site C | 33.0 | 2026-10-01 10:11:02 | IoT | 001 |
| 2026-10-01 10:05 | Site A | NULL | 2026-10-01 10:11:02 | IoT | 001 |
| 2026/10/01 10:05 | Site B | 50.4 | 2026-10-01 10:11:02 | IoT | 001 |
| 2026-10-01 10:05 | Site C | 34.2 | 2026-10-01 10:11:02 | IoT | 001 |
| 2026-10-01 10:10 | Site A | 44.1 | 2026-10-01 10:11:02 | IoT | 001 |
| 2026-10-01 10:10 | Site B | 49.8 | 2026-10-01 10:11:02 | IoT | 001 |
| 2026-10-01 10:10 | Site C | 35.1 | 2026-10-01 10:11:02 | IoT | 001 |
| 2026-10-01 10:05 | Site A | 45.3 | 2026-10-01 10:12:30 | IoT | 002 |
| 2026-10-01 10:10 | Site B | 49.8 | 2026-10-01 10:12:30 | IoT | 002 |
Why keep raw data? 🥩#
Now you might be wondering why Russell’s Electricity Company chooses to keep raw data? i.e. “why don’t we just perform transforms before ingesting into our Data-Estate?”.
Well, it’s effectively for covering our asses. Shit happens dude, pipelines break, sources change and people (being people) make mistakes.

Think about an imaginary situation at Russell’s Electricity Company where someone asks:
“Why does this number look different from what we reported three months ago?”
If we’ve already transformed everything immediately and thrown away the original data, we’ve got a problem…
However, because my company keeps the raw data, we can go back and investigate.
Silver 🥈#
The silver layer is where we start making the data nicer to work with.
We might engage in the following activities to clean and smooth our bronze data:
You might have noticed a few issues with our table if you were looking hard enough:
- Site A at
10:05isNULLin batch 001, but batch 002 contains a corrected value (45.3) - Site B at
10:05has an incorrectly formatted date (2026/10/01) - Site B at
10:10appears twice (batch 002 is an exact resend)
So, to “fix” these issues, we’d write a SQL / PySpark query that:
- Standardises the timestamp format
- Keeps one row per
site+timestamp, preferring the most recently ingested (_ingested_at) - Drops the ingestion-specific columns
Once executed, we end up with:
| timestamp | site | generation_mw |
|---|---|---|
| 2026-10-01 10:00 | Site A | 42.7 |
| 2026-10-01 10:00 | Site B | 51.2 |
| 2026-10-01 10:00 | Site C | 33.0 |
| 2026-10-01 10:05 | Site A | 45.3 |
| 2026-10-01 10:05 | Site B | 50.4 |
| 2026-10-01 10:05 | Site C | 34.2 |
| 2026-10-01 10:10 | Site A | 44.1 |
| 2026-10-01 10:10 | Site B | 49.8 |
| 2026-10-01 10:10 | Site C | 35.1 |
Eleven Bronze rows became nine Silver rows (three sites × three readings), and nothing was thrown away that we can’t recover from Bronze.
Had no correction arrived for Site A at 10:05, I’d keep the NULL rather than convert it to 0. NULL means “we don’t know”, whereas 0 means “it generated nothing”, and those lead to very different Gold numbers.
Gold 🥇#
I like golf… sorry, gold…

Gold is where we start thinking less about what the source system looks like and more about what the business wants to know.
For example, in the case of Russell’s Electricity Company, Silver contains the following columns:
timestamp
site
generation_mw
But, a (annoying) BI Analyst at the company wants:
site
date
total_generation_mwh
average_generation_mw
capacity_factor
Characteristics of Gold 🧈#
Generally, Gold datasets are often:
- aggregated
- business-oriented
- modelled for specific use cases
- optimised for reporting
- consumed by BI tools, applications, analysts or ML models
For the example of Russell’s Electricity Company, to meet the requirements of that (annoying) BI Analyst, we might make a gold table called daily_site_generation, which might look something like this:
| site | date | total_generation_mwh | average_generation_mw | capacity_factor |
|---|---|---|---|---|
| Site A | 2026-10-01 | 426.0 | 17.75 | 0.4438 |
| Site B | 2026-10-01 | 936.0 | 39.00 | 0.7800 |
| Site C | 2026-10-01 | 1034.4 | 43.10 | 0.8620 |
Common Medallion Architecture Questions ❓#
Why do I need this? 🤔#
The short answer is that you don’t always need this, but, Medallion Architecture does become useful when your data platform starts becoming more complex.
For example, imagine that Russell’s Electricity Company has an Analytics / BI Department and a ML Department.
The Analytics / BI Department wants a different version of a gold table to what the ML Department wants.
This now means that we have multiple customers, and we need a strategy to provide each group with their specific requirements.
flowchart TD
    A["Source A"] --> B["Bronze"]
    B --> C["Silver"]
    C --> D["Gold
BI"]
    C --> E["Gold
ML"]
This is the point at which having some kind of structure starts looking like a pretty good idea.
When Does Data Move Between Layers? ➡️#
This is a question that I personally had before starting this article (and my mother used to tell me that if I had a question, it’s more than likely that someone else has the same question)
To be blunt, there isn’t some ✨ magical ✨ moment when a Bronze table becomes Silver. Instead, you internally define the rules for each layer.

A useful way to think about it is that Data moves to the next layer when it meets the quality and transformation requirements of that layer.
For example:
Bronze → Silver 🥉🥈#
You might move data into Silver when:
- the schema has been interpreted
- data types are correct
- duplicates have been handled
- obvious invalid records have been dealt with
- identifiers have been standardised
- data quality checks pass
Silver → Gold 🥈🥇#
You might move data into Gold when:
- the data is trustworthy enough for consumption
- business definitions have been applied
- required joins have been performed
- aggregations have been created
- the dataset serves a specific business use case
Does Everything Have to Go Through All Three? 🏃♂️#
Nope! - This is where some of that pesky marketing starts to creep in. You might hear something like:
“All data should flow through the Bronze → Silver → Gold architecture”.
That sounds nice in theory, but it doesn’t really reflect reality.

Imagine you ingest a reference table containing:
country_code
country_name
continent
You might barely need a Bronze/Silver/Gold pipeline for that. Or perhaps you’ve got a small application where the raw data is already clean and structured.
Creating three layers because “that’s the architecture” could make the system worse, not better.
Architecture exists to solve problems, not to make diagrams look impressive.
Where does the “Marketing Hype” come in? 🔥#
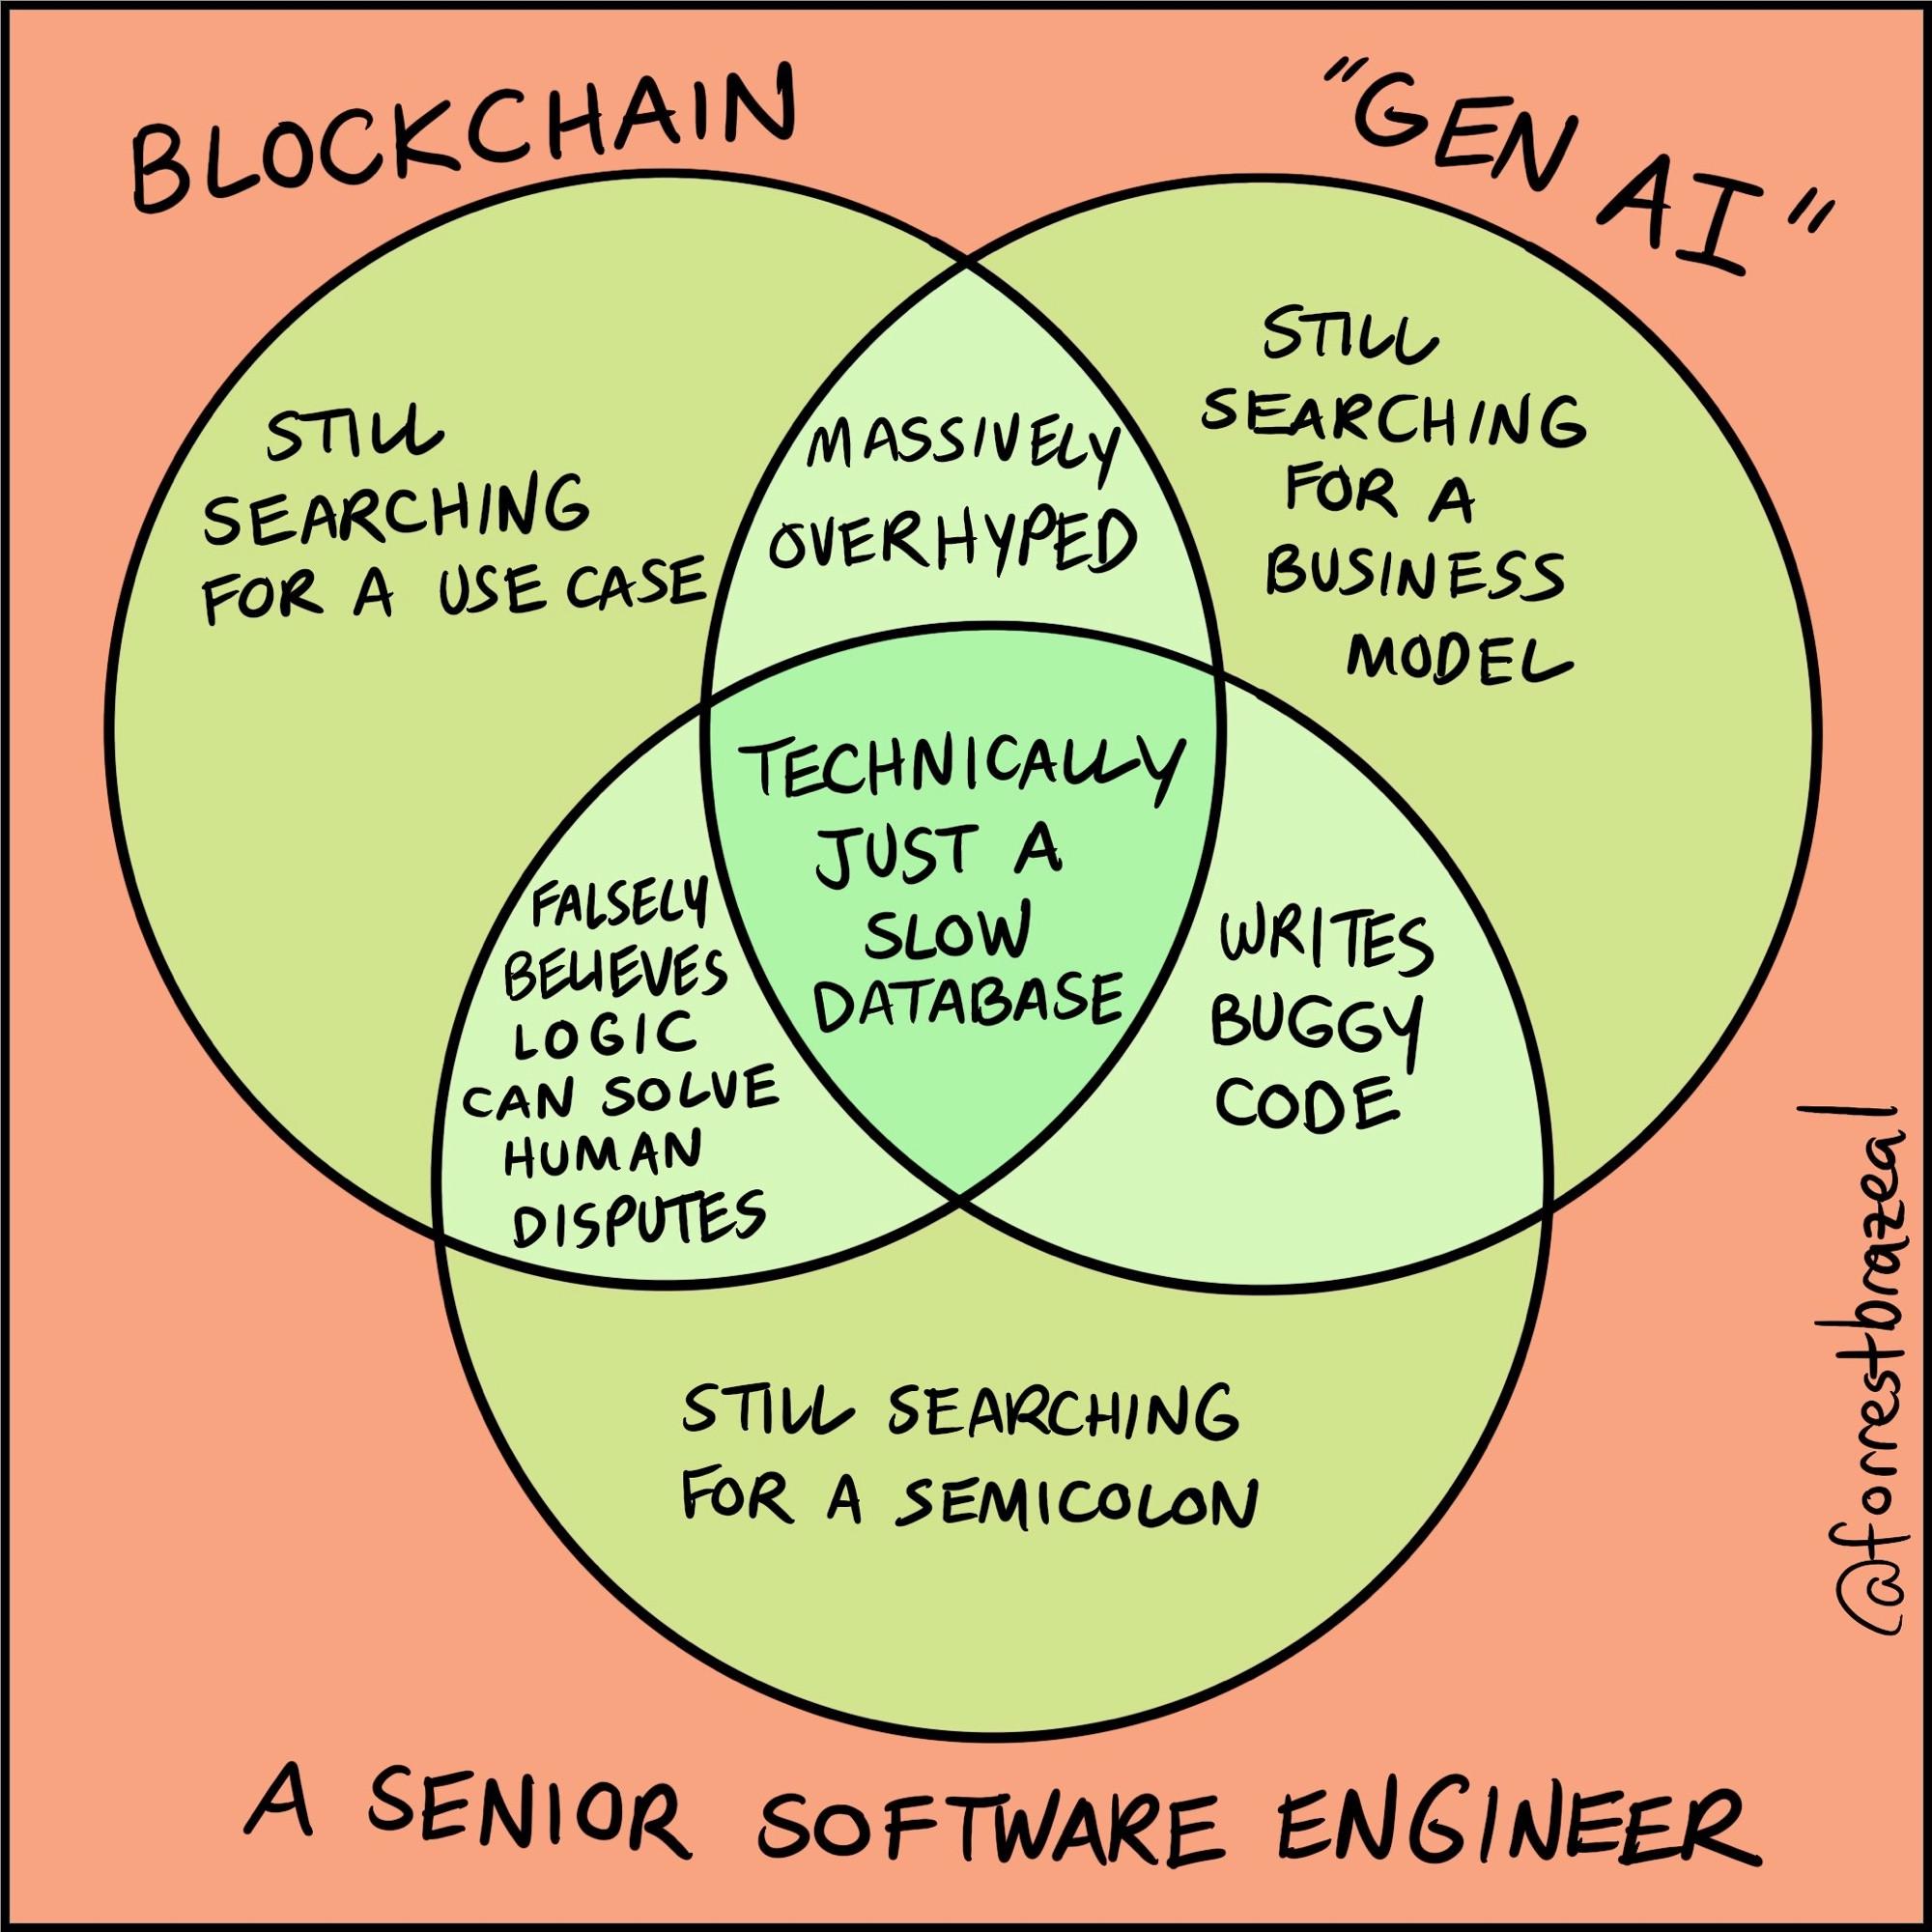
“Medallion Architecture” sounds like a grand architectural philosophy, but if you strip away the branding, the underlying idea is pretty straightforward:
Keep your raw data, clean it, then create data products from it.

The terms Bronze, Silver and Gold are useful because they give teams a shared vocabulary. Instead of saying:
“The cleaned-but-not-yet-business-modelled version of the customer data…”
you can say:
“It’s in Silver.”
The problem comes when the terminology starts being treated as a set of commandments.
Does Bronze Mean Bad? 👎#
I touched on this at the start, but one of the stranger implications of the terminology is that Bronze sounds like the “bad” data.
Bronze data can be extremely valuable. In fact, its rawness is the point. A Bronze dataset might be the only copy you have of exactly what a source system sent you.
On the flip-side silver doesn’t mean perfect! , similarly silver doesn’t always mean “clean. It’s data that has been cleaned according to the requirements of your system.
One thing to keep in mind for any scientists / analysts / engineers reading this is that data quality isn’t binary. A dataset doesn’t suddenly become trustworthy because somebody moved it to an environment / folder called “silver”.
Lastly, gold isn’t necessarily more correct than Silver. It’s usually more useful for a particular purpose.
When Should You Use Medallion Architecture? ✅#
I’d consider it when:
- you have multiple data sources
- you need reproducible transformations
- data quality is becoming a problem
- multiple teams consume the same data
- you’re starting to create multiple downstream data products
I’d probably not reach for it just because you have a CSV file + the Databricks sales team sent you an email.